P&L Reports
Track profit and loss with detailed breakdowns, expense categories, and monthly trends.
What's a P&L Report?
Profit and Loss (P&L) reports show you the money coming in, the money going out, and what's left over. It's the most important report for any business — it tells you if you're actually making money or just staying busy.
A.X.E.L generates P&L reports automatically from your invoices and expenses. No manual calculations, no spreadsheet gymnastics — just real numbers.
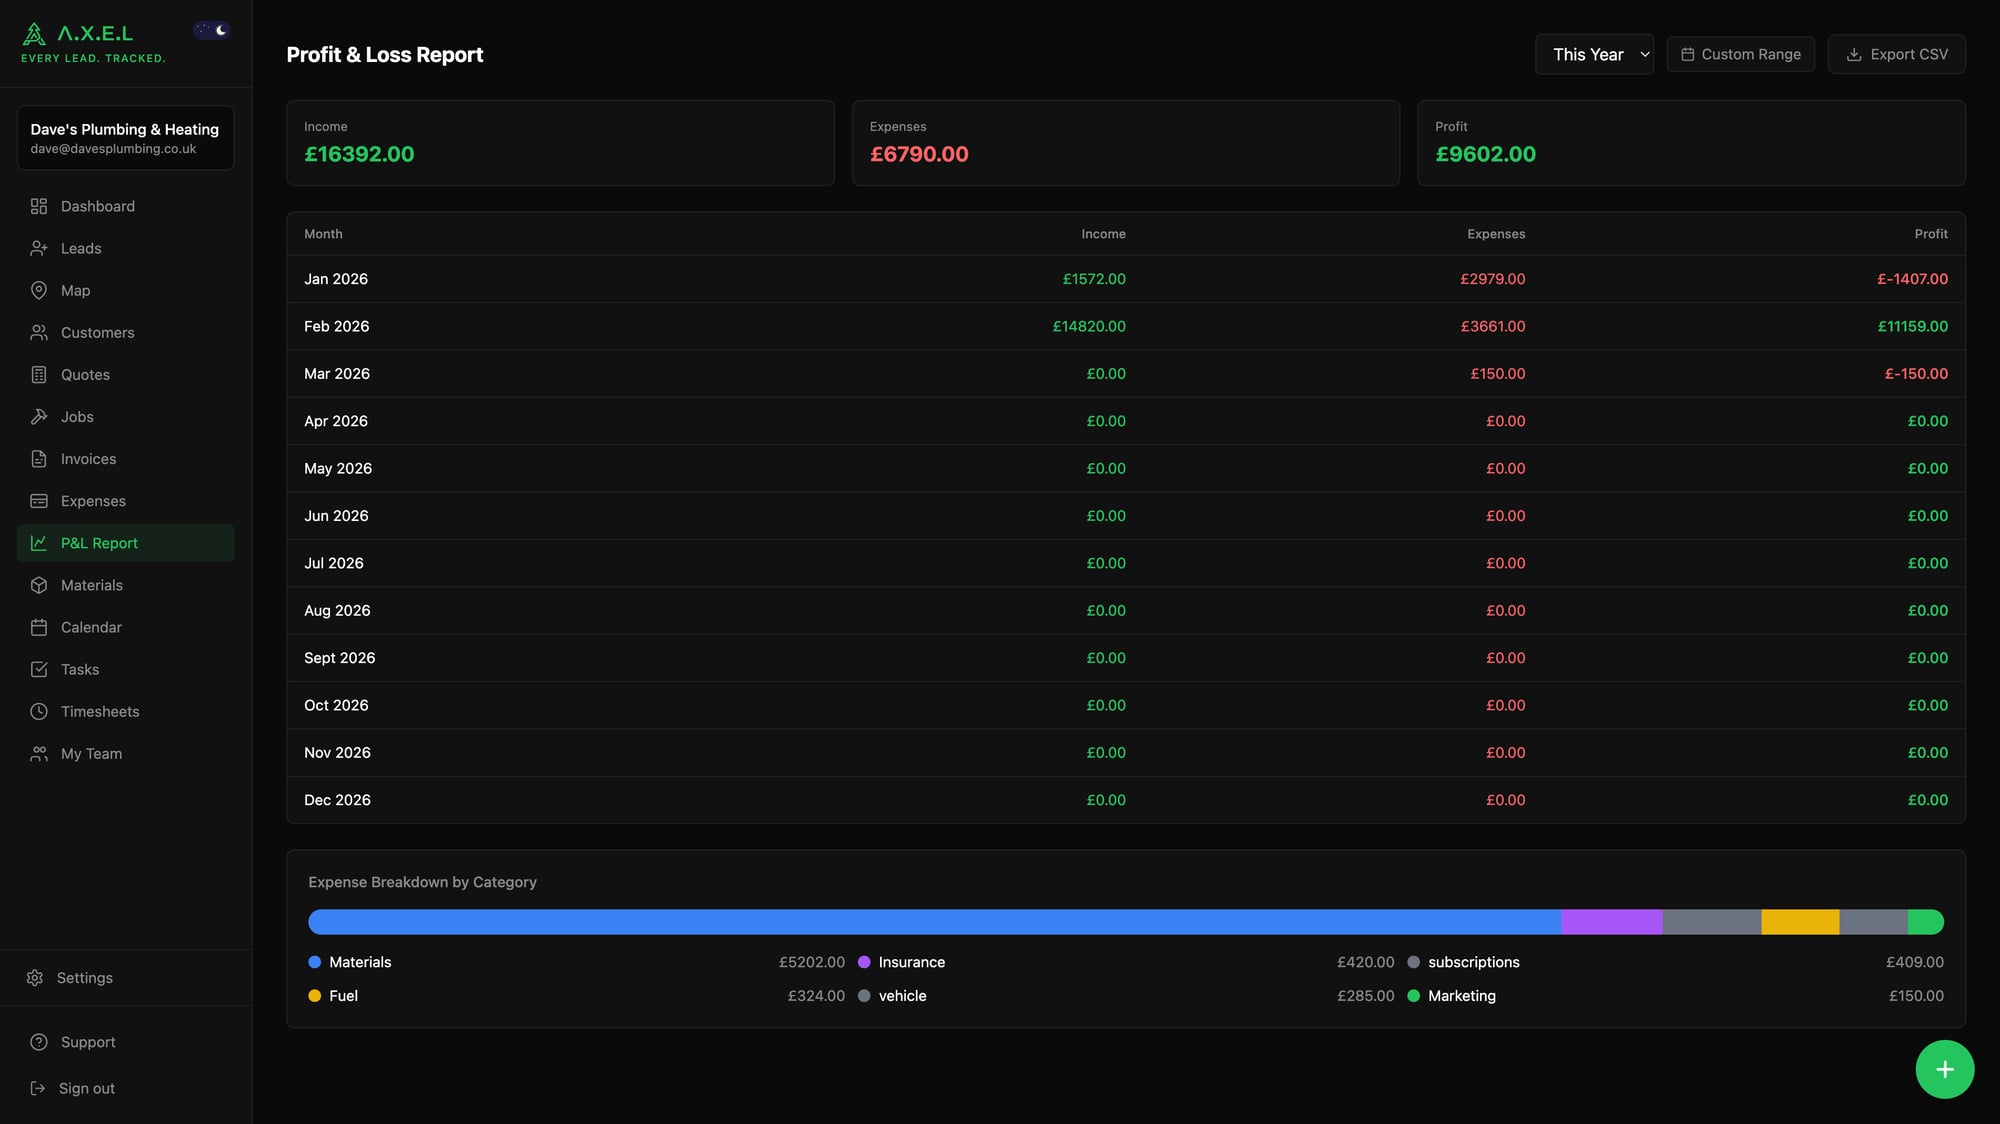
Accessing P&L Reports
- Go to Expenses from the main menu
- Tap P&L Report at the top
- Choose your date range — this year, last year, or custom dates
- The report generates automatically
Available on Enterprise plan.
What the Report Shows
Summary Section:
- Income — total from paid invoices
- Expenses — total business costs
- Profit — income minus expenses (the money you actually made)
Expense Breakdown:
- Materials — £2,450 (45% of total expenses)
- Fuel — £380 (12% of total expenses)
- Tools — £290 (8% of total expenses)
- Insurance — £180 (5% of total expenses)
- Subcontractors — £150 (4% of total expenses)
- ...and so on
Monthly Breakdown:
Shows income, expenses, and profit for each month so you can spot trends and seasonal patterns.
Reading Your P&L
Here's what to look for:
Profit Margin:
- 20%+ is excellent for most trades
- 10-20% is decent but could be better
- Under 10% means you're working for peanuts
Expense Patterns:
- Materials should be 40-60% of expenses for most trades
- Fuel costs spiking? You might be taking jobs too far from home
- Tool expenses high? Check if you're buying or replacing stuff too often
Monthly Trends:
- Steady income month-on-month is better than big peaks and valleys
- Expenses should roughly track income — high-income months = high material costs
- Consistent losses mean you need to raise prices or cut costs
Using Different Date Ranges
This Year: See how you're doing so far
Last Year: Compare against your previous performance
Custom Range: Look at specific periods — "How did Q4 perform?" or "What were the summer months like?"
Exporting Reports
Need to share numbers with your accountant or bank? Hit Export CSV and you'll get a spreadsheet with:
- Monthly breakdown of income, expenses, profit
- Category-by-category expense totals
- All formatted and ready for Excel or Google Sheets
P&L Dashboard Widget
Your main dashboard shows a mini P&L widget with the current month's numbers. Quick snapshot of how you're doing without digging into the full report.
Common Issues and Fixes
Low profit margins?
- Review your hourly rates — are you charging enough?
- Check material markup — add 20-30% to supplier costs
- Look at job costing — which types of work are most profitable?
Irregular income?
- Build up a pipeline of quotes to smooth out the peaks and valleys
- Consider recurring revenue — maintenance contracts, regular customers
Expenses too high?
- Shop around for materials — small savings add up
- Combine jobs in the same area to reduce fuel costs
- Review tool purchases — are you buying stuff you don't really need?
Was this article helpful?